


Financial statements are among the most important tools for understanding a company’s financial health. However, many business owners, entrepreneurs, managers, and investors without an accounting background often find these reports confusing and filled with technical terms.
The good news is that you do not need to be an accountant to understand financial statements. Once you learn the purpose of each statement and the key figures to focus on, you can make better business decisions, identify potential risks, and evaluate financial performance with confidence.
What Are Financial Statements and Why Do They Matter?
Financial statements are formal reports that summarize a company’s financial activities and performance over a specific period. They provide a clear picture of how much money a business earns, spends, owns, and owes.
Businesses use financial statements to:
- Monitor financial performance
- Track profitability
- Manage cash flow
- Secure financing from banks
- Attract investors
- Comply with legal and tax requirements
Investors, lenders, business owners, and managers all rely on financial statements to make informed decisions.
The Three Core Financial Statements
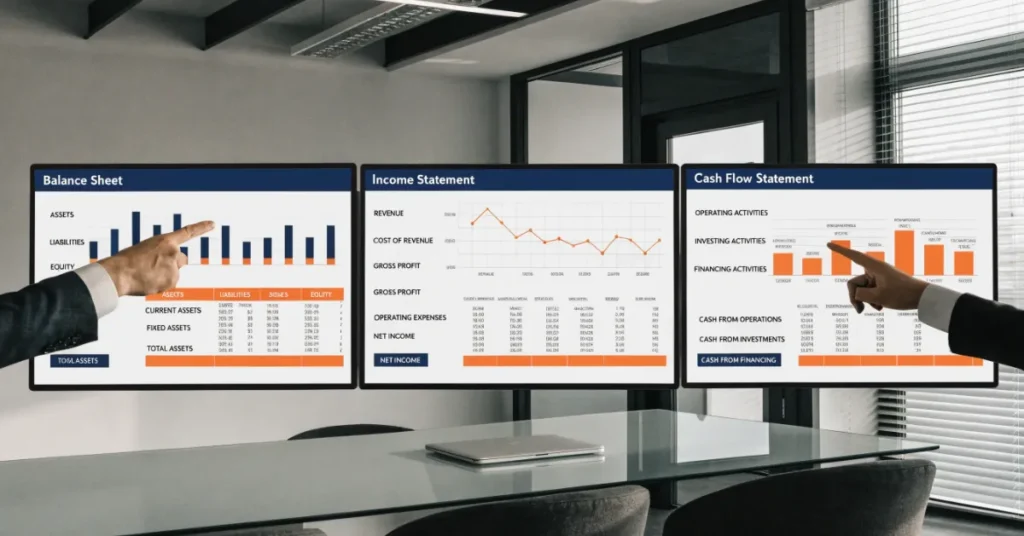
Every business typically prepares three primary financial statements:
- Balance Sheet
- Income Statement
- Cash Flow Statement
Each report serves a different purpose but works together to provide a complete picture of financial health.
Additional Financial Reports Businesses Use
Larger organizations may also prepare:
- Statement of Changes in Equity
- Notes to Financial Statements
- Auditor’s Report
- Management Discussion and Analysis (MD&A)
These reports provide additional details that help stakeholders understand financial results more thoroughly.
Understanding the Balance Sheet Explained Simply
The balance sheet provides a snapshot of a company’s financial position at a specific point in time. It shows what the business owns, what it owes, and the value remaining for its owners.
The balance sheet follows a simple accounting equation:
Assets = Liabilities + Equity
This equation must always balance.
Assets: What the Business Owns
Assets are resources that provide economic value to the company.
Examples include:
- Cash and bank balances
- Inventory
- Accounts receivable
- Property and equipment
- Investments
- Vehicles
- Technology assets
Assets are generally classified as current assets or non-current assets.
Current assets can typically be converted into cash within one year, while non-current assets support long-term operations.
Liabilities: What the Business Owes
Liabilities represent financial obligations that the company must pay.
Common liabilities include:
- Bank loans
- Trade payables
- Tax liabilities
- Lease obligations
- Employee benefits payable
- Credit facilities
Like assets, liabilities are divided into current and long-term categories.
Equity: The Owner’s Share
Equity represents the residual interest in the business after liabilities are deducted from assets.
Key components include:
- Share capital
- Retained earnings
- Additional paid-in capital
- Owner contributions
A growing equity balance often indicates a financially healthy business.
Quick Example of Reading a Balance Sheet
Imagine a company reports:
| Item | Amount |
|---|---|
| Total Assets | $500,000 |
| Total Liabilities | $200,000 |
| Total Equity | $300,000 |
The company owns assets worth $500,000 and owes creditors $200,000. The remaining $300,000 belongs to the owners.
When reviewing a balance sheet, pay close attention to:
- Cash reserves
- Debt levels
- Inventory growth
- Accounts receivable
- Equity trends
These figures can reveal important information about financial stability.
How to Read an Income Statement (Profit and Loss Statement)
The income statement, also known as the Profit and Loss (P&L) Statement, shows how much money a company earned and spent during a specific period.
Unlike the balance sheet, which represents a single date, the income statement covers a period such as a month, quarter, or year.
Its primary purpose is to measure profitability.
Key Sections of an Income Statement
Most income statements include the following sections:
Revenue
Revenue refers to the total income generated from selling products or services.
Examples include:
- Product sales
- Service income
- Subscription revenue
- Consulting fees
Revenue is often called the “top line.”
Cost of Goods Sold (COGS)
COGS includes the direct costs associated with producing goods or delivering services.
Examples include:
- Raw materials
- Manufacturing costs
- Direct labor
- Production expenses
Gross Profit
Gross Profit is calculated using the formula:
Gross Profit = Revenue – Cost of Goods Sold
This figure shows how efficiently a company produces its products or services.
Operating Expenses
Operating expenses are costs incurred while running the business.
Examples include:
- Salaries
- Rent
- Utilities
- Marketing expenses
- Insurance
- Office expenses
Net Profit
Net profit represents the final profit after all expenses, taxes, and interest have been deducted.
This is often referred to as the “bottom line.”
Step-by-Step Example
Consider a small consulting business with the following annual results:
| Description | Amount |
|---|---|
| Revenue | $200,000 |
| Direct Costs | $50,000 |
| Gross Profit | $150,000 |
| Operating Expenses | $90,000 |
| Net Profit | $60,000 |
This means the business generated $60,000 in profit after covering all costs.
Common Income Statement Mistakes Non-Accountants Make
Many beginners misinterpret income statements because they focus on only one figure.
Common mistakes include:
- Assuming high revenue means high profitability
- Ignoring operating expenses
- Focusing only on net profit
- Overlooking trends over multiple periods
- Failing to compare profit margins
A company can generate millions in revenue but still struggle financially if expenses grow too quickly.
To properly analyze an income statement, review both revenue growth and expense management together.
Understanding the balance sheet and income statement provides a strong foundation for financial statement analysis. However, these reports do not show the complete picture. Cash movement often tells a very different story, which is why understanding the cash flow statement is equally important.
Understanding the Cash Flow Statement
Many non-accountants focus primarily on profit when evaluating a business. However, profit does not always equal cash. A company can appear profitable on paper while facing serious cash shortages.
The cash flow statement tracks the actual movement of cash into and out of the business during a specific period. It helps stakeholders understand whether a company has enough cash to operate, invest, and meet its financial obligations.
The cash flow statement is divided into three main sections.
Operating Activities
Operating activities include cash generated from the company’s core business operations.
Examples include:
- Cash received from customers
- Payments to suppliers
- Employee salaries
- Rent payments
- Utility expenses
- Tax payments
Positive operating cash flow generally indicates that the business generates enough cash from its normal operations.
Investing Activities
Investing activities relate to the purchase or sale of long-term assets.
Examples include:
- Purchasing equipment
- Buying property
- Selling machinery
- Acquiring investments
- Selling investments
Negative cash flow in this section is not always a bad sign. It may indicate that a business is investing in future growth.
Financing Activities
Financing activities involve transactions related to funding the business.
Examples include:
- Obtaining bank loans
- Repaying debt
- Issuing shares
- Owner contributions
- Dividend payments
This section shows how a company finances its operations and expansion.
Real-Life Example: Profitable but Running Out of Cash
Imagine a business generates $500,000 in sales and reports a healthy profit.
However, most customers pay after 90 days.
While revenue appears strong, the company may not receive cash quickly enough to pay employees, suppliers, and rent.
As a result, the business could face cash flow problems despite reporting profits.
This is why experienced business owners often say:
“Cash is king.”
A strong cash flow statement helps identify these risks before they become serious problems.
How the Three Financial Statements Work Together
Many beginners view financial statements as separate reports. In reality, they are closely connected.
Understanding this relationship makes financial analysis much easier.
The Financial Statement Flow
The process typically works as follows:
- The company generates revenue.
- Revenue and expenses create profit.
- Profit affects cash flow.
- Cash movements impact assets and liabilities.
- Changes appear on the balance sheet.
For example:
- A sale increases revenue on the income statement.
- If the customer has not paid yet, accounts receivable increases on the balance sheet.
- When the customer pays, cash increases on the balance sheet and appears on the cash flow statement.
This connection provides a complete picture of business performance.
Key Financial Ratios Every Non-Accountant Should Know
Financial ratios simplify complex financial data and help compare performance over time.
Even non-accountants can use ratios to identify strengths and weaknesses.
Liquidity Ratios
Liquidity ratios measure a company’s ability to meet short-term obligations.
Current Ratio
Formula:
Current Assets ÷ Current Liabilities
A ratio above 1 generally indicates that the company can pay its short-term debts.
Quick Ratio
Formula:
(Current Assets – Inventory) ÷ Current Liabilities
This ratio focuses on the most liquid assets available.
Profitability Ratios
Profitability ratios measure how effectively a company generates profits.
Gross Profit Margin
Formula:
Gross Profit ÷ Revenue × 100
A higher margin indicates efficient production and pricing strategies.
Net Profit Margin
Formula:
Net Profit ÷ Revenue × 100
This ratio shows how much profit remains after all expenses.
Return on Assets (ROA)
Formula:
Net Income ÷ Total Assets × 100
ROA measures how efficiently management uses assets to generate profits.
Efficiency Ratios
Efficiency ratios evaluate operational performance.
Inventory Turnover
Measures how quickly inventory sells.
Higher turnover often indicates efficient inventory management.
Receivables Turnover
Measures how quickly customers pay outstanding invoices.
A higher ratio typically means faster collections.
Debt Ratios
Debt ratios assess financial risk.
Debt-to-Equity Ratio
Formula:
Total Debt ÷ Total Equity
A lower ratio generally indicates lower financial risk.
Interest Coverage Ratio
Formula:
Operating Income ÷ Interest Expense
This ratio measures a company’s ability to pay interest on its debt.
Red Flags to Watch for When Reviewing Financial Statements
Financial statements often reveal warning signs before major problems occur.
Watch for these common red flags:
- Declining cash balances
- Increasing debt levels
- Falling profit margins
- Negative operating cash flow
- Rising accounts receivable
- Rapid inventory growth
- Frequent net losses
- Increasing operating expenses
- Heavy dependence on borrowing
- Significant year-to-year fluctuations
One red flag alone may not indicate trouble. However, several warning signs appearing together deserve closer investigation.
How Business Owners Can Use Financial Statements to Make Better Decisions

Financial statements are not just compliance documents. They are powerful decision-making tools.
Business owners can use financial reports to:
- Improve pricing strategies
- Control operating costs
- Plan expansion projects
- Evaluate investments
- Secure financing
- Manage working capital
- Improve profitability
Example Scenarios
Opening a New Branch
A business owner can review cash reserves, profitability, and debt levels before expanding.
Hiring New Employees
Financial reports help determine whether payroll costs are sustainable.
Purchasing Equipment
The cash flow statement can reveal whether the company can afford major investments.
Applying for Financing
Banks often analyze financial statements before approving loans.
Businesses with strong financial performance typically receive better financing terms.
Financial Statement Review Checklist for Beginners
Reviewing financial statements regularly can help identify issues early.
Monthly Review Checklist
✔ Review monthly revenue trends
✔ Compare actual expenses against budget
✔ Monitor cash balances
✔ Analyze profit margins
✔ Review customer receivables
✔ Monitor supplier payments
✔ Check inventory levels
✔ Track outstanding debt
Quarterly Review Checklist
✔ Compare financial performance year-over-year
✔ Evaluate financial ratios
✔ Assess profitability trends
✔ Review cash flow patterns
✔ Measure business growth
✔ Update financial forecasts
Consistent reviews help business owners make informed decisions throughout the year.
Common Financial Terms Non-Accountants Should Understand
Understanding key financial terms makes reading reports much easier.
Revenue
Income generated from business activities.
Expenses
Costs incurred to operate the business.
Gross Profit
Revenue minus direct production costs.
Net Profit
Final profit after all expenses.
Assets
Resources owned by the company.
Liabilities
Financial obligations owed by the company.
Equity
Owner’s interest in the business.
Cash Flow
Movement of cash into and out of the business.
Working Capital
Current assets minus current liabilities.
Depreciation
Reduction in asset value over time.
Accounts Receivable
Money owed by customers.
Accounts Payable
Money owed to suppliers.
EBITDA
Earnings before interest, taxes, depreciation, and amortization.
Many investors use EBITDA to assess operational performance.
Technology and Tools That Simplify Financial Statement Analysis
Modern technology makes financial reporting easier than ever.
Popular tools include:
- Accounting software
- Cloud bookkeeping platforms
- Financial dashboards
- Business intelligence tools
- Budgeting software
- KPI tracking systems
These tools automate calculations and generate reports quickly.
Benefits of Financial Reporting Software
Businesses benefit from:
- Real-time financial insights
- Improved accuracy
- Faster reporting
- Better forecasting
- Enhanced decision-making
- Reduced manual errors
Technology allows non-accountants to understand financial data without performing complex calculations manually.
How Ripple Business Setup Can Help with Financial Management and Compliance
Understanding financial statements is essential for making informed business decisions, maintaining compliance, and supporting long-term growth. Ripple Business Setup assists entrepreneurs, startups, SMEs, and established companies with professional business setup, accounting, bookkeeping, financial reporting, tax compliance, and advisory services across the UAE. Whether you need help interpreting financial statements, improving financial reporting processes, or ensuring compliance with UAE regulations, the experienced team at Ripple Business Setup can provide practical guidance tailored to your business needs. For expert assistance, contact Ripple Business Setup at +971 50 593 8101, email info@ripplellc.ae, or WhatsApp +971 4 250 0833.
FAQ
Can I understand financial statements without an accounting background?
Yes. By learning the purpose of each statement and focusing on key metrics, non-accountants can confidently analyze financial reports.
Which financial statement should I review first?
Most beginners start with the income statement because it shows revenue, expenses, and profit. However, reviewing all three statements together provides a complete picture.
How often should I review financial reports?
Business owners should review key reports monthly and perform more detailed analysis quarterly.
What is the difference between profit and cash flow?
Profit represents earnings after expenses, while cash flow measures actual cash moving into and out of the business.
What financial ratio is most important for beginners?
The current ratio, net profit margin, and debt-to-equity ratio are excellent starting points for understanding financial health.
Conclusion
Learning how to read financial statements is one of the most valuable skills a business owner, manager, entrepreneur, or investor can develop. While financial reports may seem intimidating at first, understanding the balance sheet, income statement, and cash flow statement becomes much easier when you focus on their core purpose.
Disclaimer: This article is for general informational and educational purposes only and should not be considered accounting, financial, tax, or legal advice. Readers should consult qualified professionals for advice specific to their business circumstances.